
See how your data connects.Understand what it means.
GraphHub helps you model people, systems, cases, assets, events, research subjects, or any other connected data. Import messy spreadsheets, define your own schema, explore relationships visually, and turn the same graph into analyses, dashboards, data views, and reports.
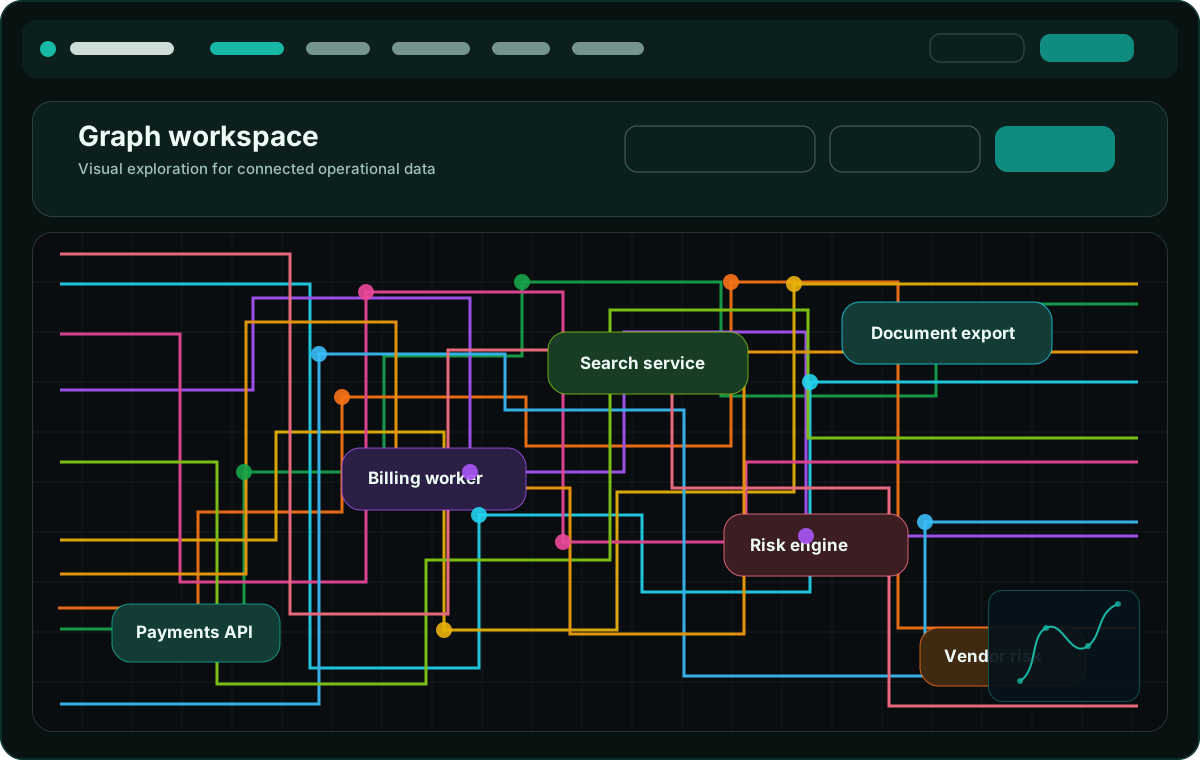
Model anything.Explore every connection.
GraphHub is not tied to one industry or one data shape. Use it for technology maps, investigation boards, research datasets, operational dependencies, asset networks, knowledge maps, or whatever domain needs relationships to become visible.
Model your domain
Create custom node and relationship schemas for whatever you need to understand.
Explore relationships
Navigate dependencies, responsibilities, evidence chains, ownership, influence, and hidden links.
Analyze without rebuilding
Use the same graph for charts, matrices, statistics, dashboards, reports, and joined data views.
Share with control
Keep graphs public or private, manage roles, require MFA, and track important changes with audit logs.
Useful wherever relationships matter
Technology architecture
Map apps, services, APIs, incidents, vendors, ownership, and risk.
Investigations
Connect people, locations, events, evidence, timelines, and open questions.
Research and statistics
Model subjects, observations, categories, measurements, cohorts, and correlations.
Operations and knowledge maps
Turn responsibilities, assets, processes, documents, and decisions into navigable context.
From spreadsheet to graph insight
Start from CSV imports and custom schemas. Then reuse the same connected model for visual exploration, data views, analysis widgets, report snapshots, and public read-only demos.
1
Define your schema
2
Explore relationships
3
Publish insights
Start with a graph. End with insight.
Use the demo to see how a connected model becomes a workspace, dashboard, analysis catalog, data view, and report system.